Make data-driven decisions
Gain insight into your operation and discover opportunities for improvement by monitoring historical visitation schedules and status.


With SimpliRoute we guarantee traceability and efficiency to our customers.
Diana Arenas
Operations Manager, X Cargo
Want to learn more about making data-driven decisions?
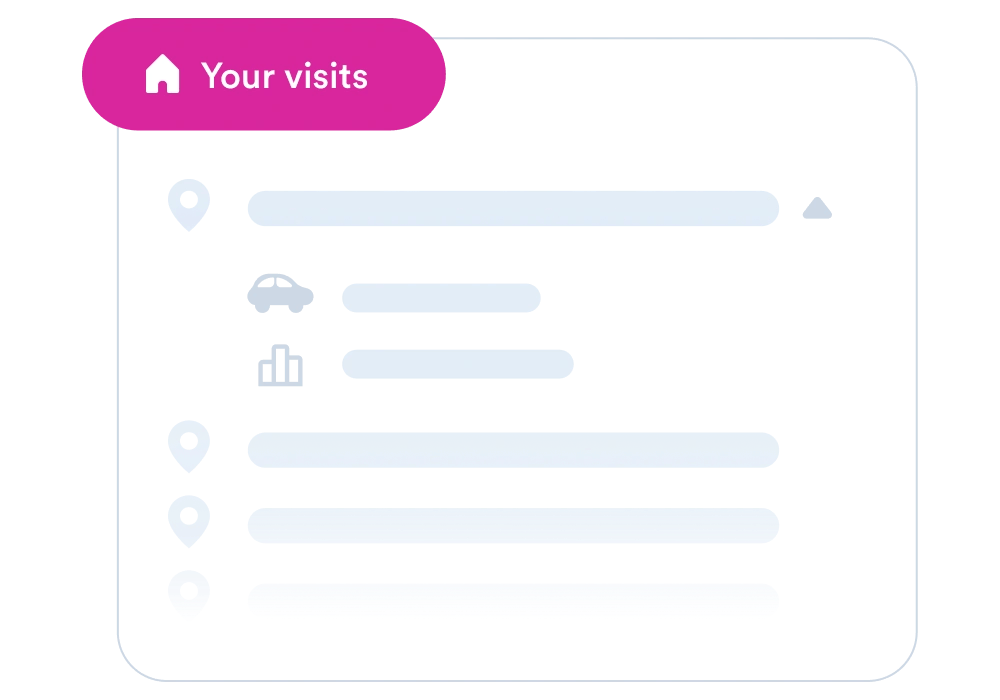
Review in detail the visits made and vehicles used
Obtain your visit history and find out how many vehicles you need to make your visits or deliveries.
- Download metrics at the end of the month and calculate the cost of your deliveries
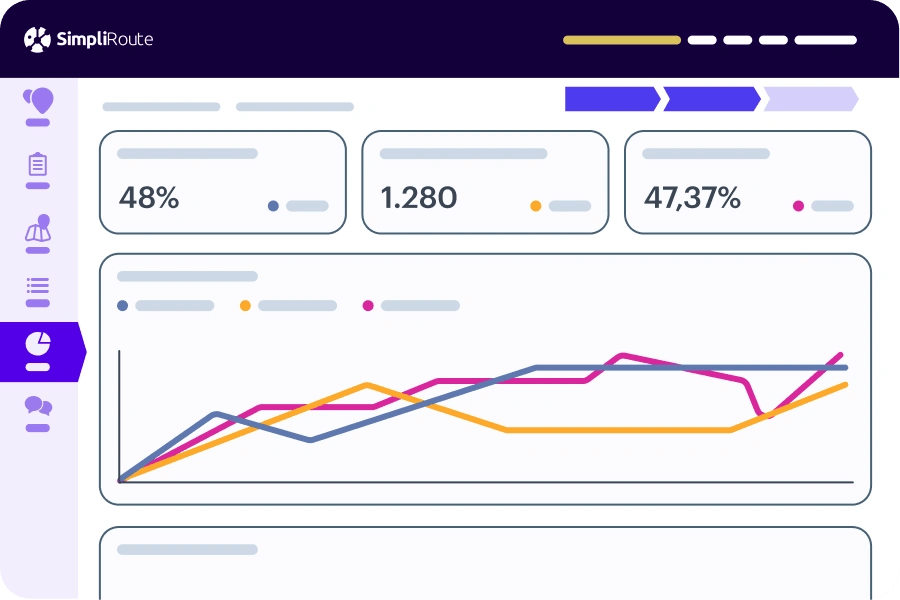
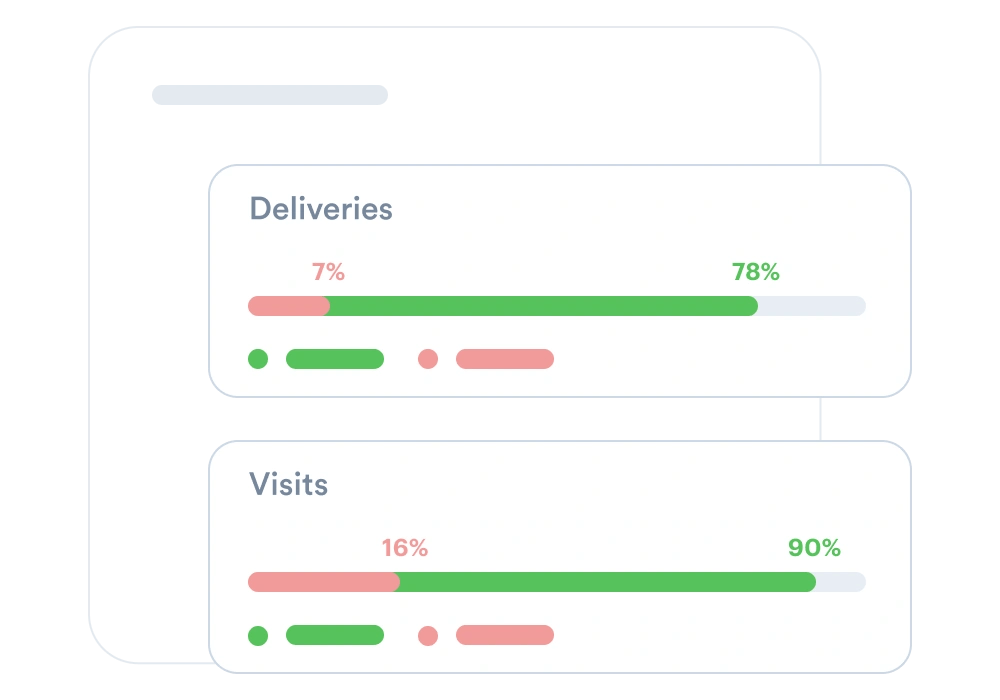
Calculates and monitors relevance ratios
Keep track of your operation by looking at all the key indicators to know if your logistics are being what your customer expects.
- Delivery success/failure rate
- Rate of timely visits
- Under/over use of vehicle fleet
Generate custom reports
Every business is unique and has special needs. We generate tailor-made reports to make SimpliRoute the ultimate solution to manage your logistics.